A common misconception about IRI data
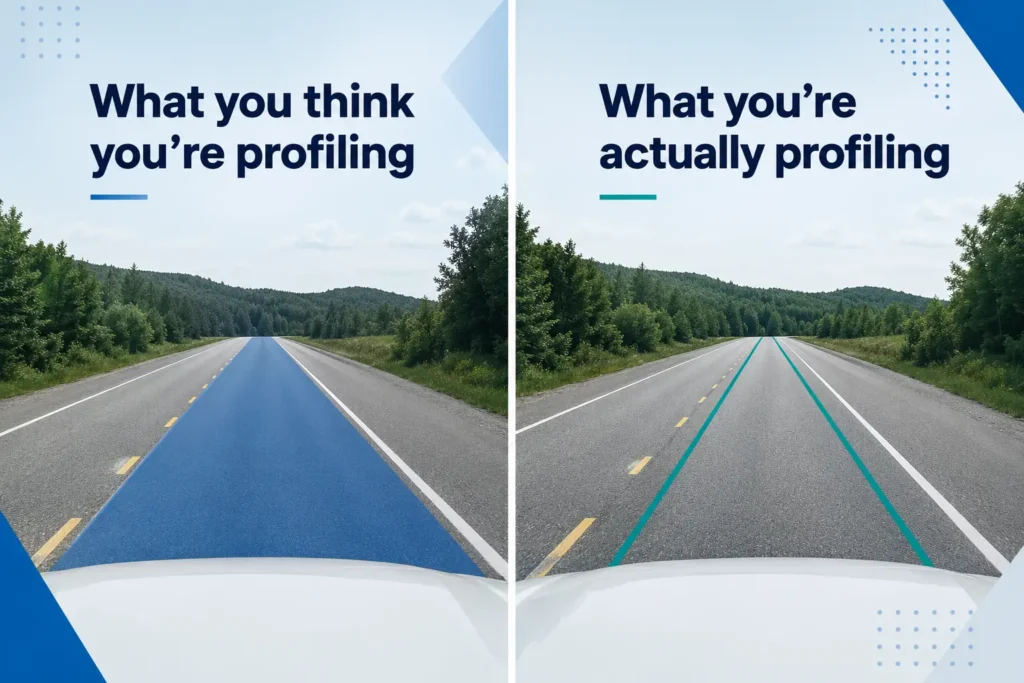
What a single IRI run tells you about a road surface is one of the most common misconceptions we encounter. Whether someone is completely new to road condition data collection or has been operating a laser profiler for years, the same misunderstanding often shows up: people assume the IRI value from a single pass represents the roughness of the full width of the lane being driven.
In reality, the equipment is only measuring the longitudinal profile of the thin path travelled by the sensor. Each path has a different profile, which means each path can produce a different IRI value. If there is significant lateral variability in the road surface, there will also be significant variability between IRI runs.
The largest source of variability between IRI runs is the road surface itself.
This matters in two important situations: collecting IRI for asset management purposes, and comparing two IRI data collection technologies.
What an IRI sensor is actually measuring
Common bumper-mounted laser profilers typically have two sensors, one approximately aligned with the left wheel path and one approximately aligned with the right wheel path. When data is collected with this setup, two IRI values are produced. Each IRI value is calculated from the profile recorded along the narrow path travelled by that individual sensor.
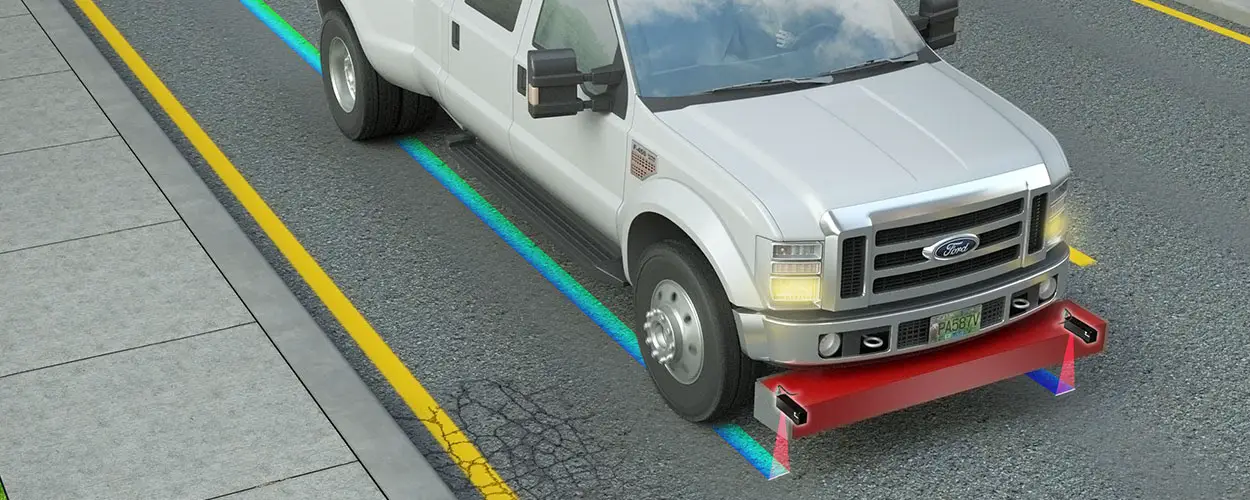
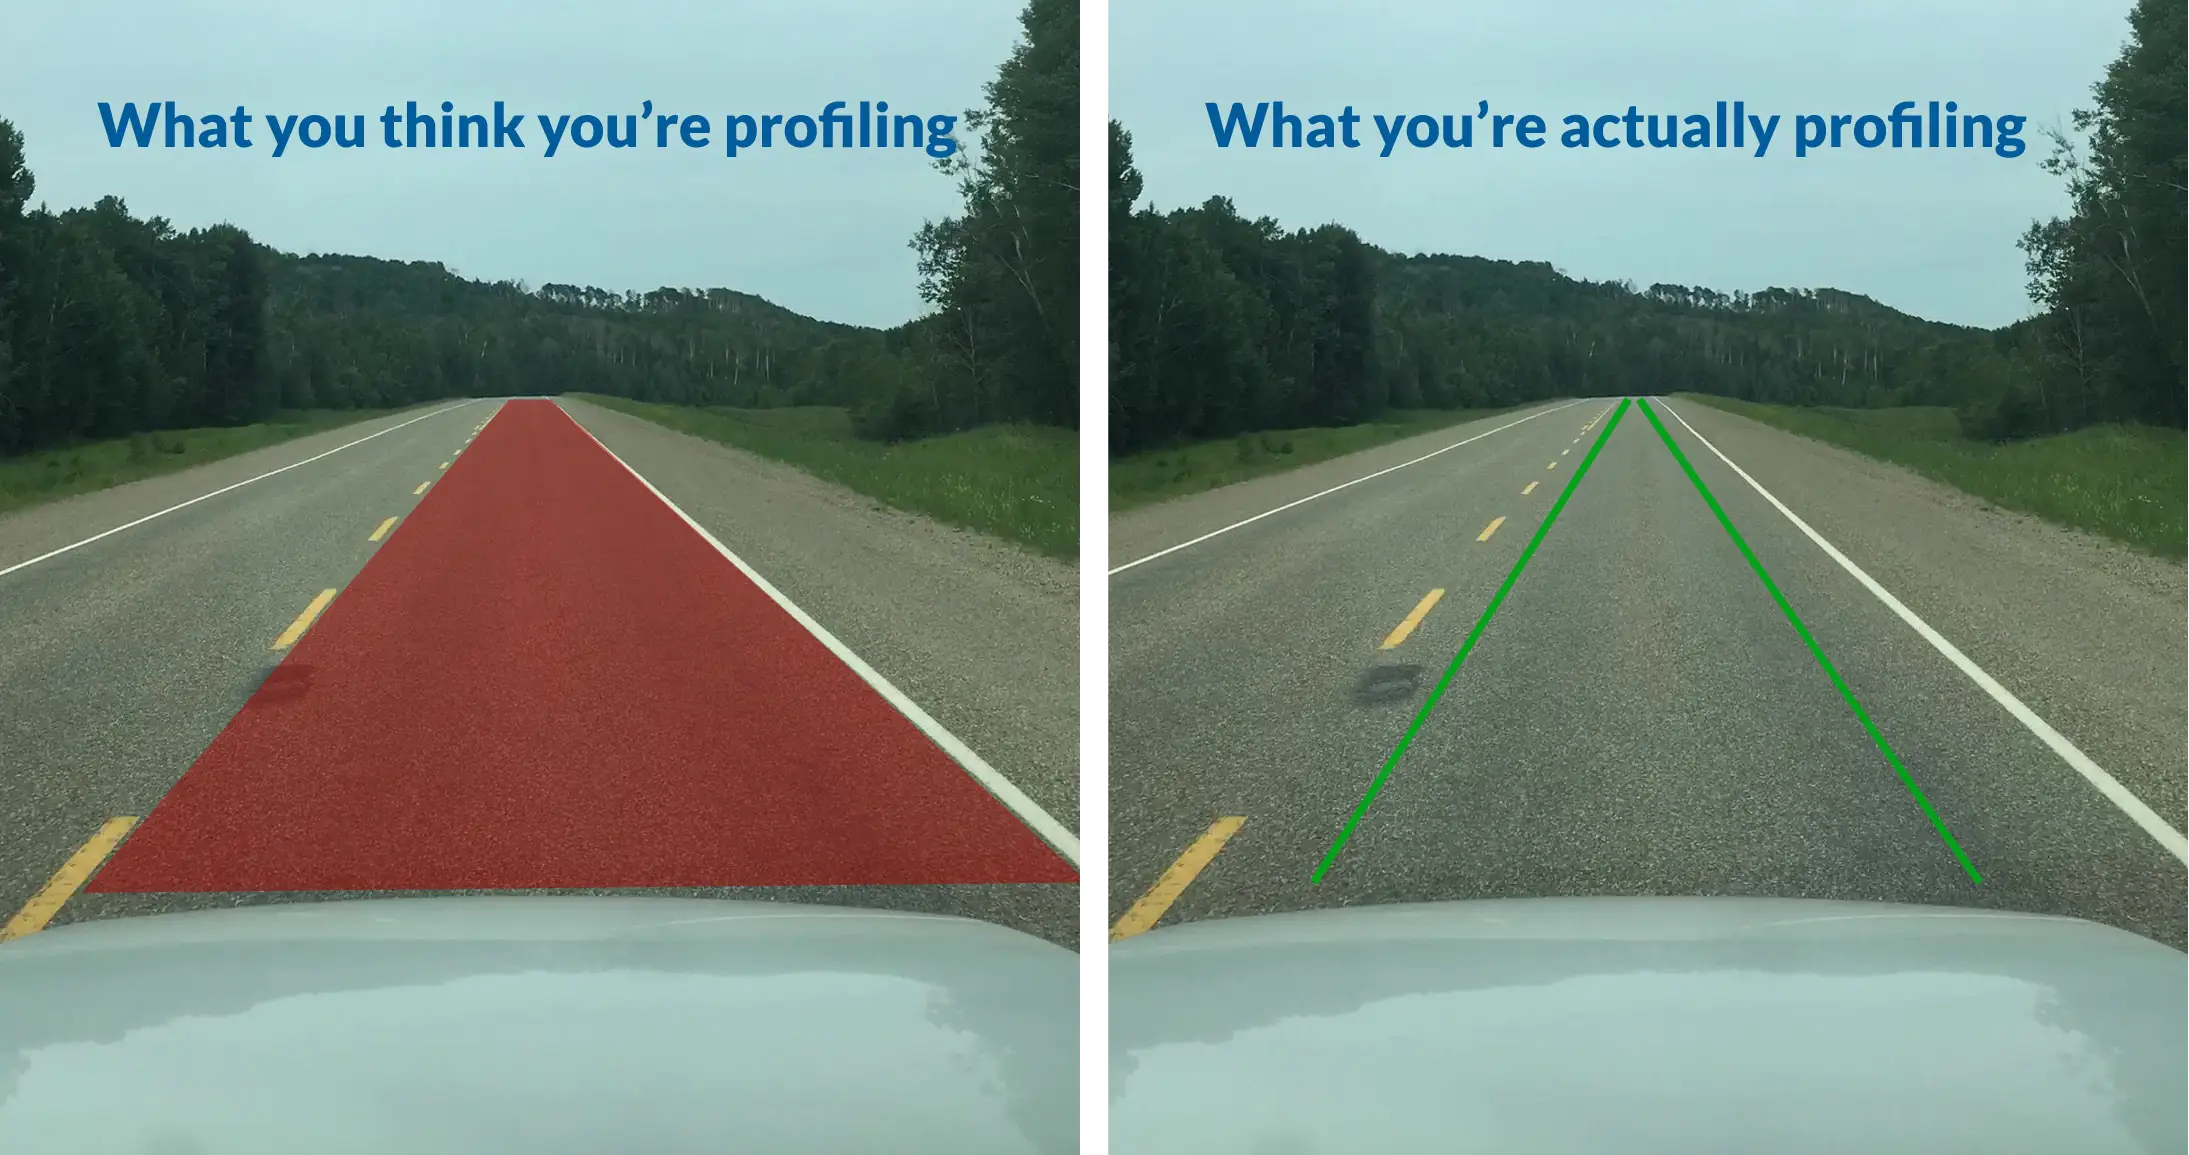
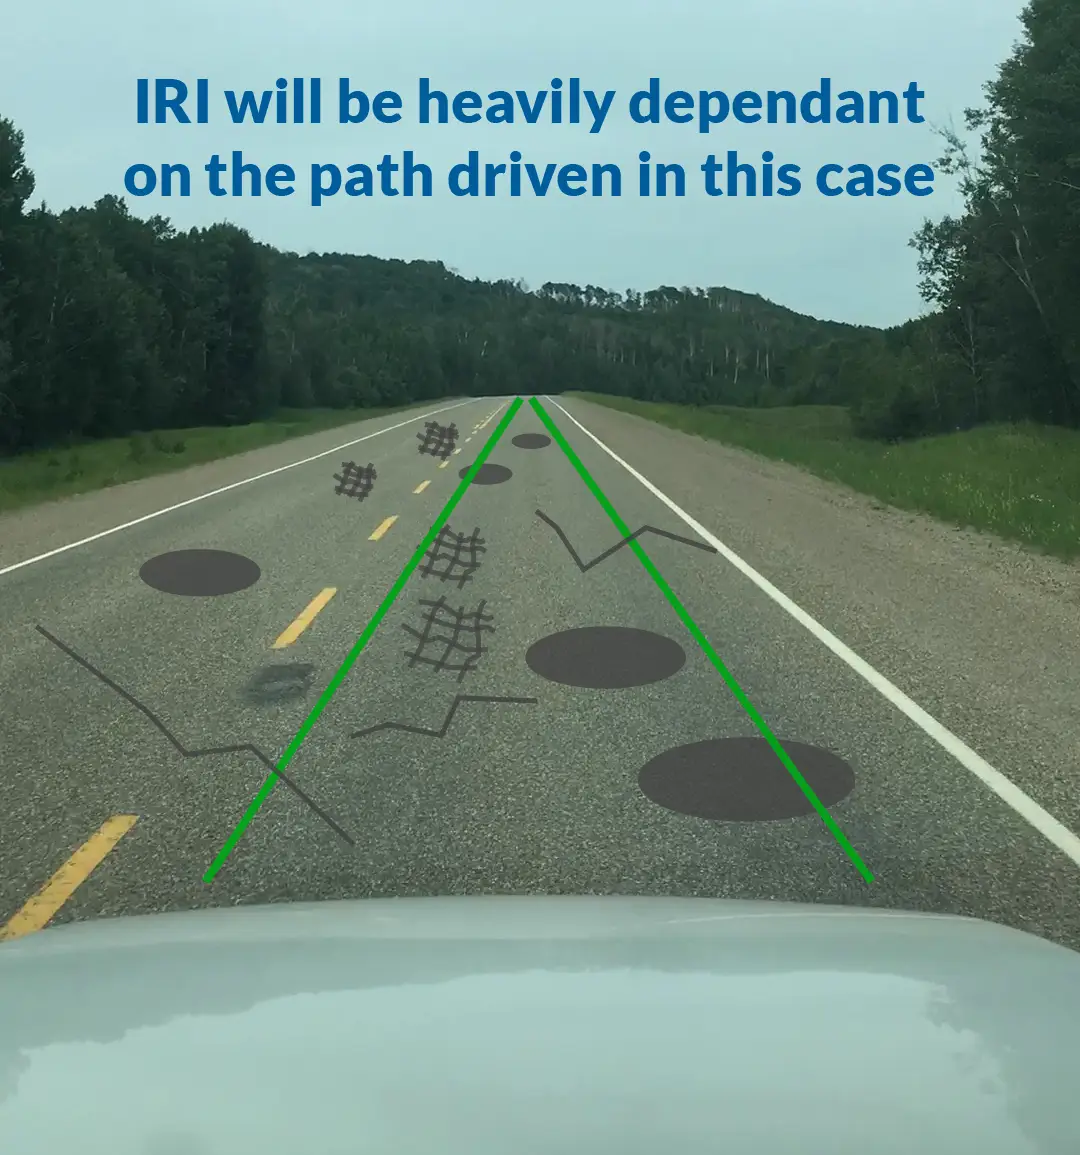
If you imagined attaching a can of spray paint to each sensor, the painted lines would show the exact paths used to calculate the IRI values. The same idea applies to a smartphone-based platform like TotalPave, except the sensor is the phone mounted to the windshield rather than a laser sensor mounted near the bumper.
Why path matters
Imagine a lane where one path is relatively smooth while another path contains a line of potholes. A sensor travelling over the smooth path would report a relatively low IRI value, while a sensor travelling over the distressed path would report a much higher IRI value.
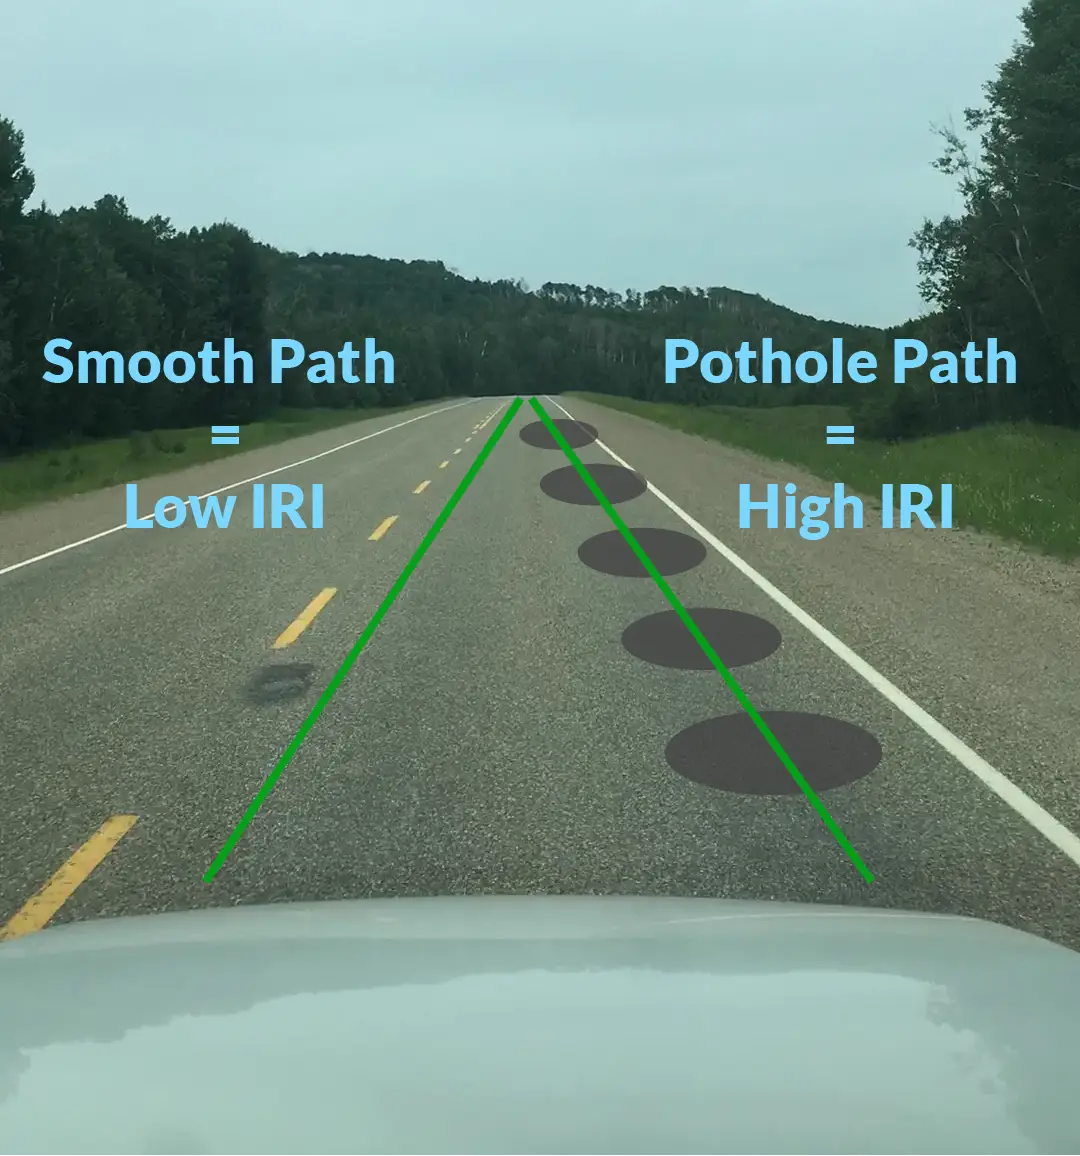
In the real world, distresses are not usually arranged in neat lines. Cracking, potholes, and other surface defects occur randomly across the road surface. That randomness creates lateral variability, which means even small changes in the path driven can produce a different longitudinal profile and therefore a different IRI value.
Real-world lateral variability
The table below shows real data collected with a bumper-mounted Class 1 laser profiler manufactured by Surface Systems & Instruments. One sensor recorded the left wheel path and one recorded the right wheel path. IRI was reported in 100 m intervals.
| 100m Seg Start (m) | 100m Seg End (m) | IRI Wheelpath 1 (m/km) | IRI Wheelpath 2 (m/km) | Percent Diff (%) |
|---|---|---|---|---|
| 0 | 100 | 5.74 | 6.99 | 19.7% |
| 100 | 200 | 24.16 | 8.01 | 100.4% |
| 200 | 300 | 3.48 | 6.61 | 62.0% |
| 300 | 400 | 5.00 | 5.02 | 0.3% |
| 400 | 500 | 2.99 | 3.82 | 24.3% |
| 500 | 600 | 3.67 | 4.84 | 27.4% |
| 600 | 700 | 8.11 | 5.74 | 34.3% |
| 700 | 800 | 5.83 | 7.16 | 20.5% |
| 800 | 900 | 6.18 | 5.83 | 5.9% |
| 900 | 1000 | 4.45 | 4.64 | 4.1% |
| 1000 | 1100 | 7.94 | 7.07 | 11.7% |
| 1100 | END | 4.45 | 4.36 | 2.1% |
| AVERAGE | 6.83 | 5.84 | 26.1% |
Only three of the corresponding wheel-path IRI values were within 5% of each other, and the average percent difference between the two wheel paths was more than 25%. The largest difference occurred on the 100 m to 200 m segment, where the gap between wheel-path readings was more than 100%.
These results do not suggest the profiler was faulty. The profiler had recently been calibrated and confirmed to be in good working order. What the data shows is that the road surface itself had extreme lateral variability. Even though the two measured paths were not very far apart, they still produced dramatically different IRI values.
Why multiple passes matter
Each IRI run is essentially a sample of a thin slice of road. A single run does not represent the roughness of the entire width of the lane. To build a more representative estimate of overall lane roughness, multiple passes can be collected across different paths and averaged together.
The number of passes required depends on how much lateral variability exists. On heavily distressed roads, roughness values can vary significantly from one path to another, so it may take many runs before the average begins to stabilize. On very smooth roads, fewer passes are needed because the path driven has much less effect on the result.
Example from a very smooth road
The table below shows data collected using TotalPave IRI and an ARRB Hawkeye Class 1 profiler on the same very smooth road section. Three runs were collected with each technology. For the Hawkeye profiler, the reported IRI value is the average of the left and right wheel-path sensors.
| Run | TotalPave IRI (m/km) | ARRB Hawkeye (m/km) |
|---|---|---|
| RUN 1 | 0.59 | 0.58 |
| RUN 2 | 0.59 | 0.58 |
| RUN 3 | 0.58 | 0.58 |
In this case, the IRI values are nearly identical regardless of the path driven or the technology used. That is because the road surface exhibited very little lateral variability.
Collecting IRI for asset management purposes
Traditional laser profilers are often used by consulting firms to collect IRI data for asset management plans. To control data collection costs, it is common to perform only one pass in one lane in one direction and use that single value to represent the entire section.
That approach can be reasonable on very smooth roads, but municipal and county roads often exhibit much higher levels of random distress and therefore much higher lateral variability. In those cases, a single pass may be precise, but it may not be an accurate representation of the roughness of the full road surface.
TotalPave has been compared to traditional Class 1 equipment many times. Overall, the expected precision of a single IRI value collected using TotalPave is within about 10% of a Class 1 laser profiler, assuming lateral variability and other random sources of error are controlled.
That comparison speaks to precision. In practice, however, the larger question is accuracy: does the reported IRI value actually reflect the roughness of the road section as a whole?
This is where a smartphone-based platform can offer a practical advantage. Because data collection is much lower cost and easier to perform, it becomes feasible to collect multiple passes, cover multiple lanes and directions, and build a more representative average IRI for the whole road segment.
With TotalPave, users simply mount a phone to the windshield, press a large button in the app, and drive. Data collection is automated, which means IRI can even be collected passively during other survey work. At minimum, one value per segment can be obtained to match the basic standard often used with traditional profilers, but many segments can end up with several IRI values collected over the course of a project.
The more slices of road that are sampled, the more accurate the average representation of overall roughness becomes. A traditional profiler could also collect multiple passes, but in most network-level projects that approach would usually be cost prohibitive.
Comparing two IRI data collection technologies
When comparing two IRI data collection methods, it is critical to control for random sources of error. Two of the largest are section start and end point, and lateral variability in the road surface.
Section start and end point
If the start or end point differs between methods, the two devices are effectively profiling different road sections. Relying on manual start and stop points based on visual cues, such as a pole or guardrail, introduces unnecessary error because human reaction time is not precise enough. At highway speeds, even a small reaction delay can shift the measured section by several metres.
TotalPave automatically maps IRI data to GIS centrelines, which eliminates concern about inconsistent section start and end points. When comparing data against a laser profiler, the GPS coordinates from the profiler run can be used to create matching lines in the TotalPave system.
Lateral variability in the road surface
Lateral variability is more difficult to control. The best option is to use a closed test track specifically designed to produce known IRI values regardless of path driven. Unfortunately, access to that type of facility is rare.
The next best option is to compare methods on a very smooth road, such as a freshly paved highway. Even then, it is still important to attempt to drive the same path and to perform multiple runs with each setup.
If a freshly paved test section is not available, the least desirable option is to test on the best road available and continue collecting runs until the average roughness stabilizes. Seeing a difference between methods after only a few runs does not necessarily mean the methods disagree. More often, it means the road surface has significant lateral variability and more runs are needed before the averages can be meaningfully compared.
Precision versus accuracy
Traditional profilers can be extremely precise, and that precision is valuable. But precision and accuracy are not the same thing. If only a single pass is collected on a road section with meaningful lateral variability, the resulting value may not accurately represent the roughness of the full road surface.
That is the core reason a lower-cost, easier-to-use smartphone platform can offer a real advantage for network-level asset management. It makes multiple passes practical, which helps improve the accuracy of the final average roughness value.
In that sense, a smartphone may be less precise on a one-to-one comparison, but more capable of helping practitioners build a more accurate representation of roughness across a full road section.
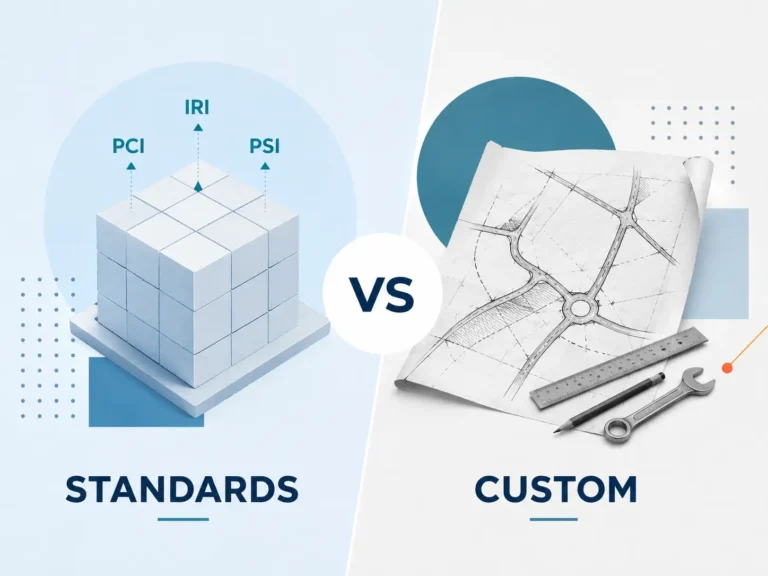
Methodology Shootout: Standards vs. Custom Road Performance Measures
An argument for not reinventing the wheel when it comes to developing your road condition assessment framework.
Read More
Is your organization ready for road condition data?
Avoid this simple (but common) mistake to ensure you get your road asset management planning started on a solid foundation
Read More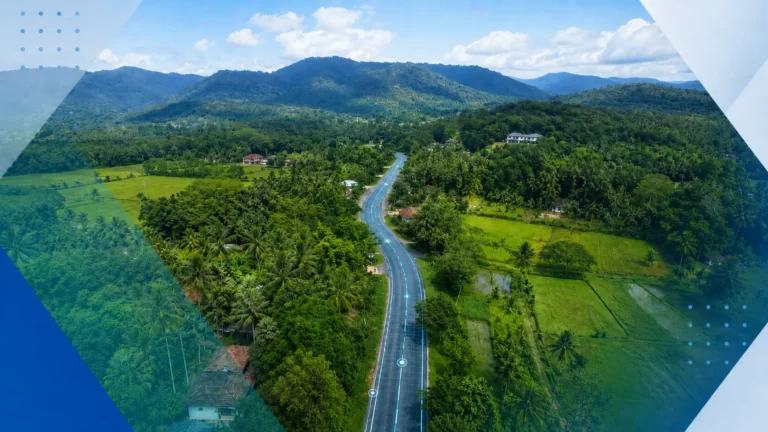
TotalPave IRI Supporting Rural Road Improvement in Sri Lanka
How TotalPave’s smartphone-based IRI data collection helped support large-scale rural road assessment for Sri Lanka’s Inclusive Connectivity and Development Project.
Read More